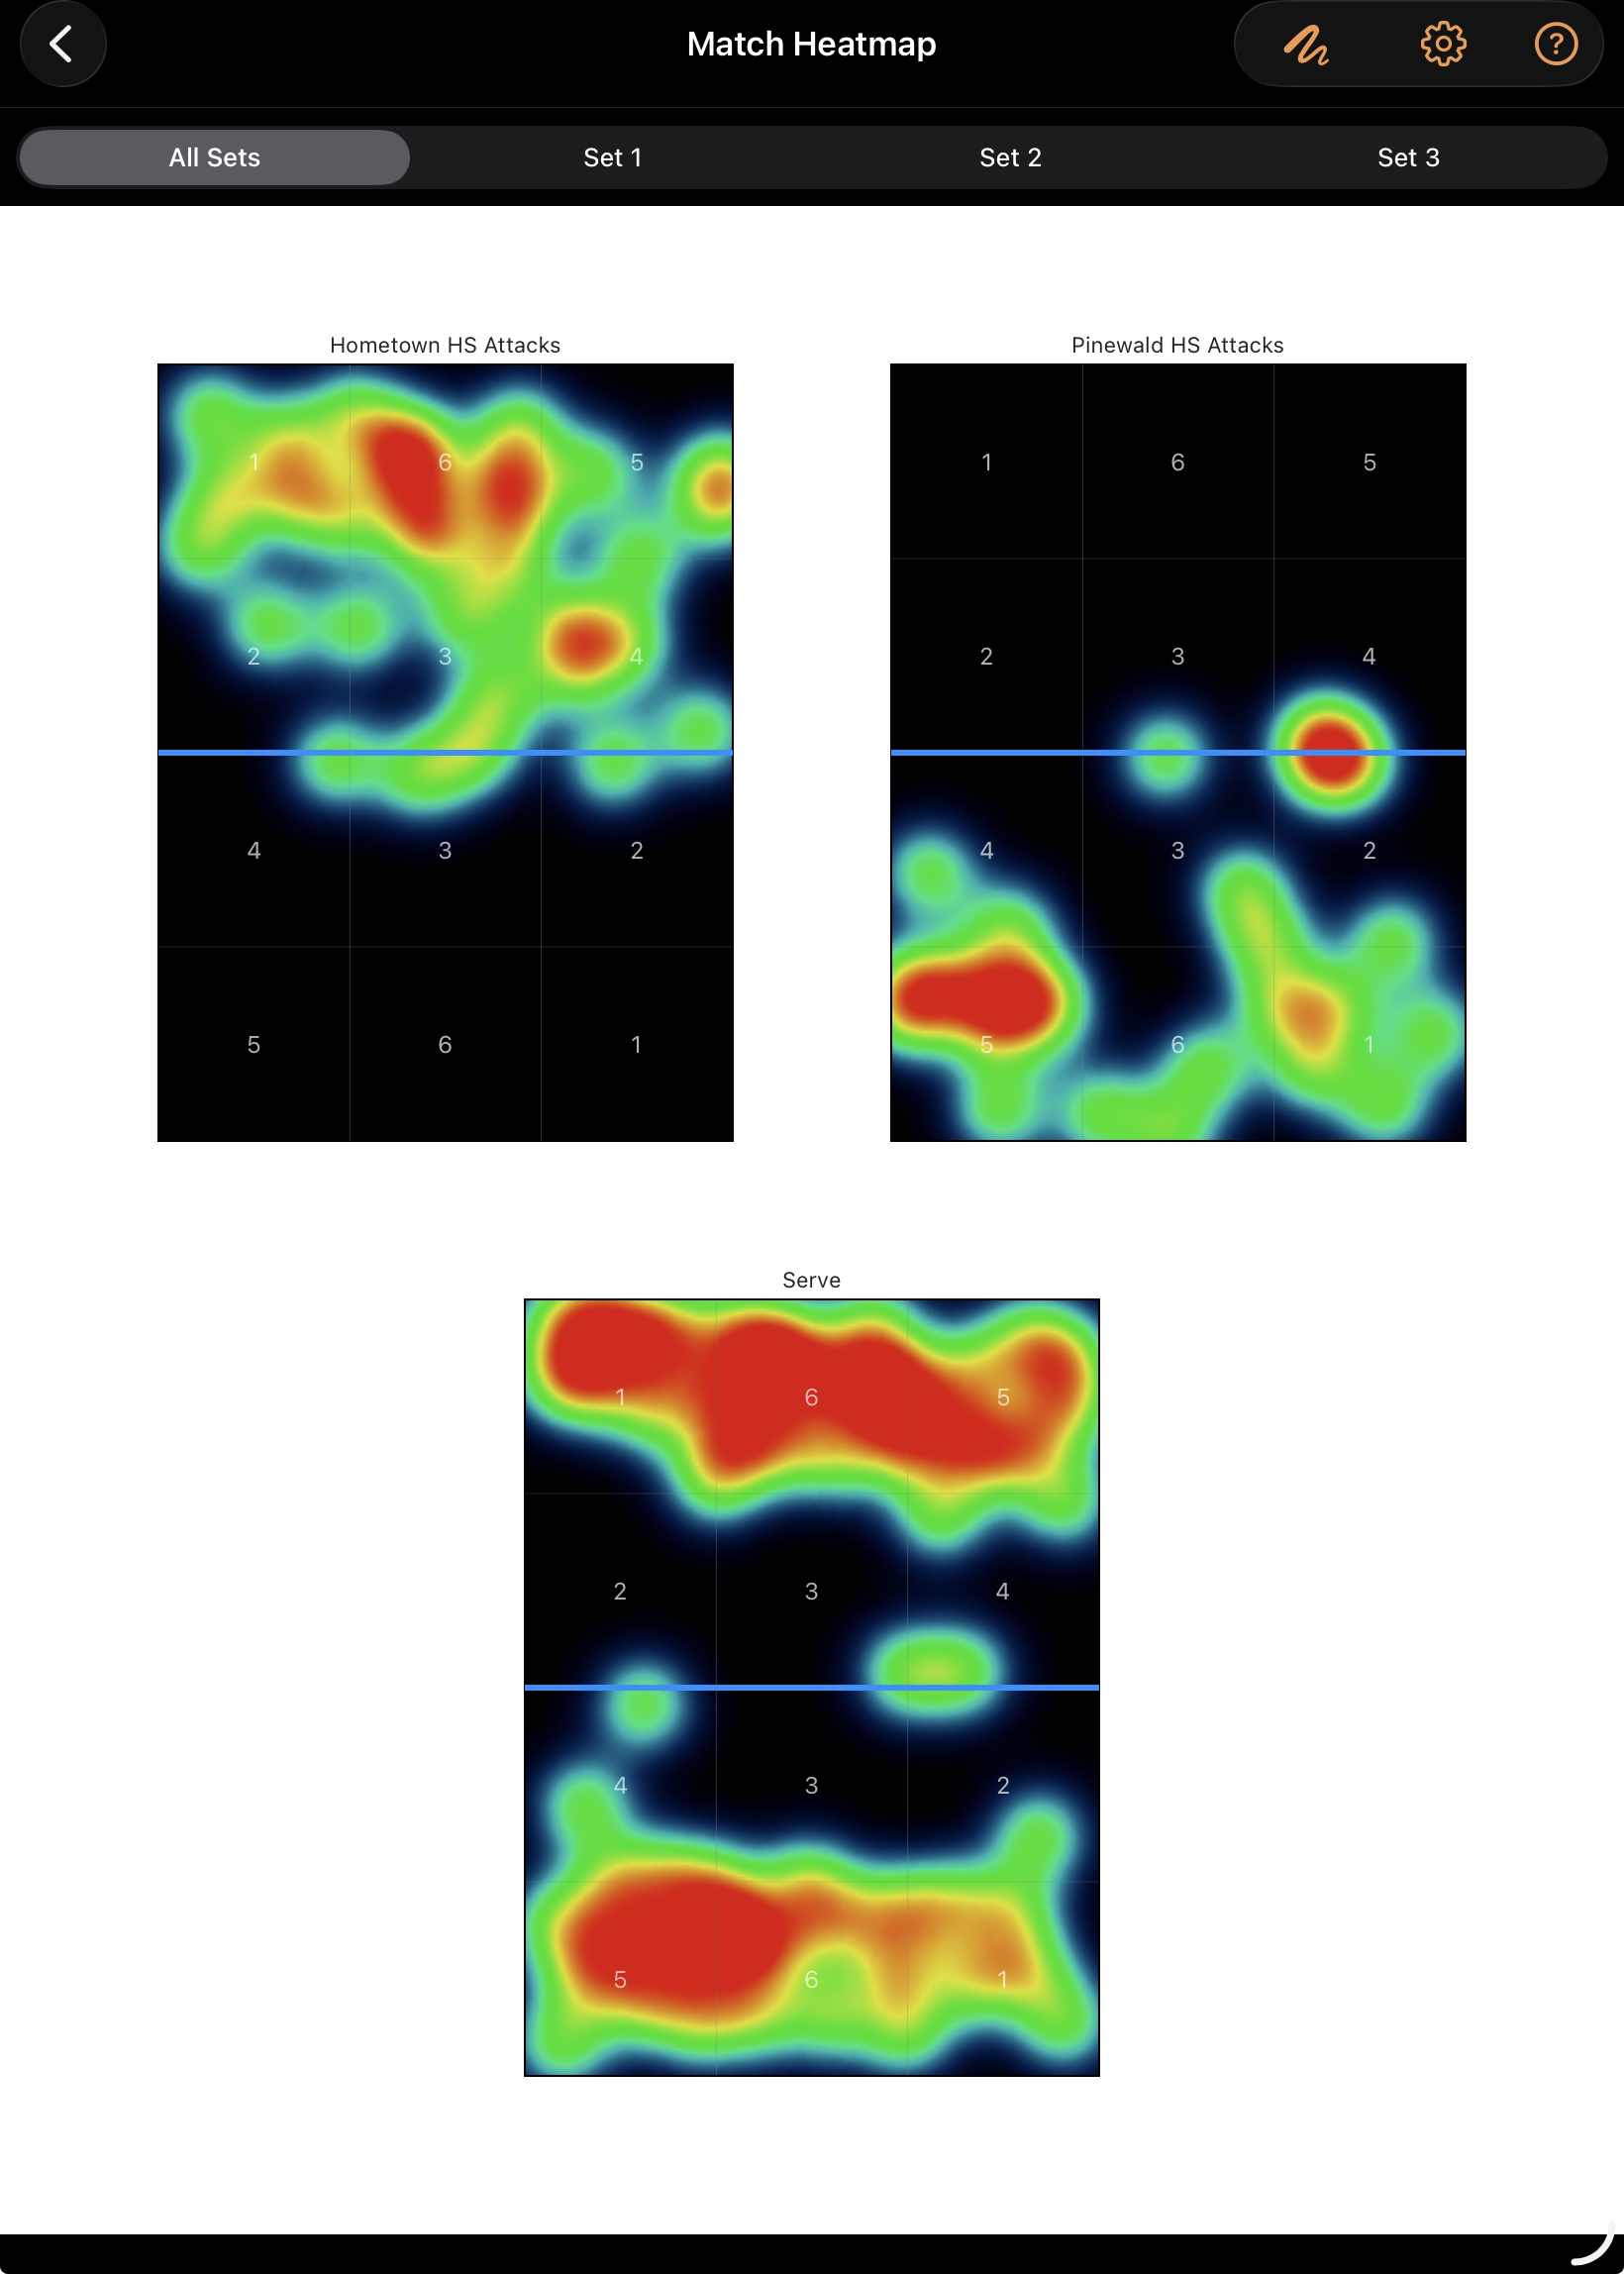
Team Growth
How the team is trending, not just this match
Team Growth is a season-long trend module, separate from single-match stats — six ways to see how your team is developing over a season, all built from real charted match data. Each Season's Team Growth hub also links straight to the full Season Stats table for the complete breakdown.
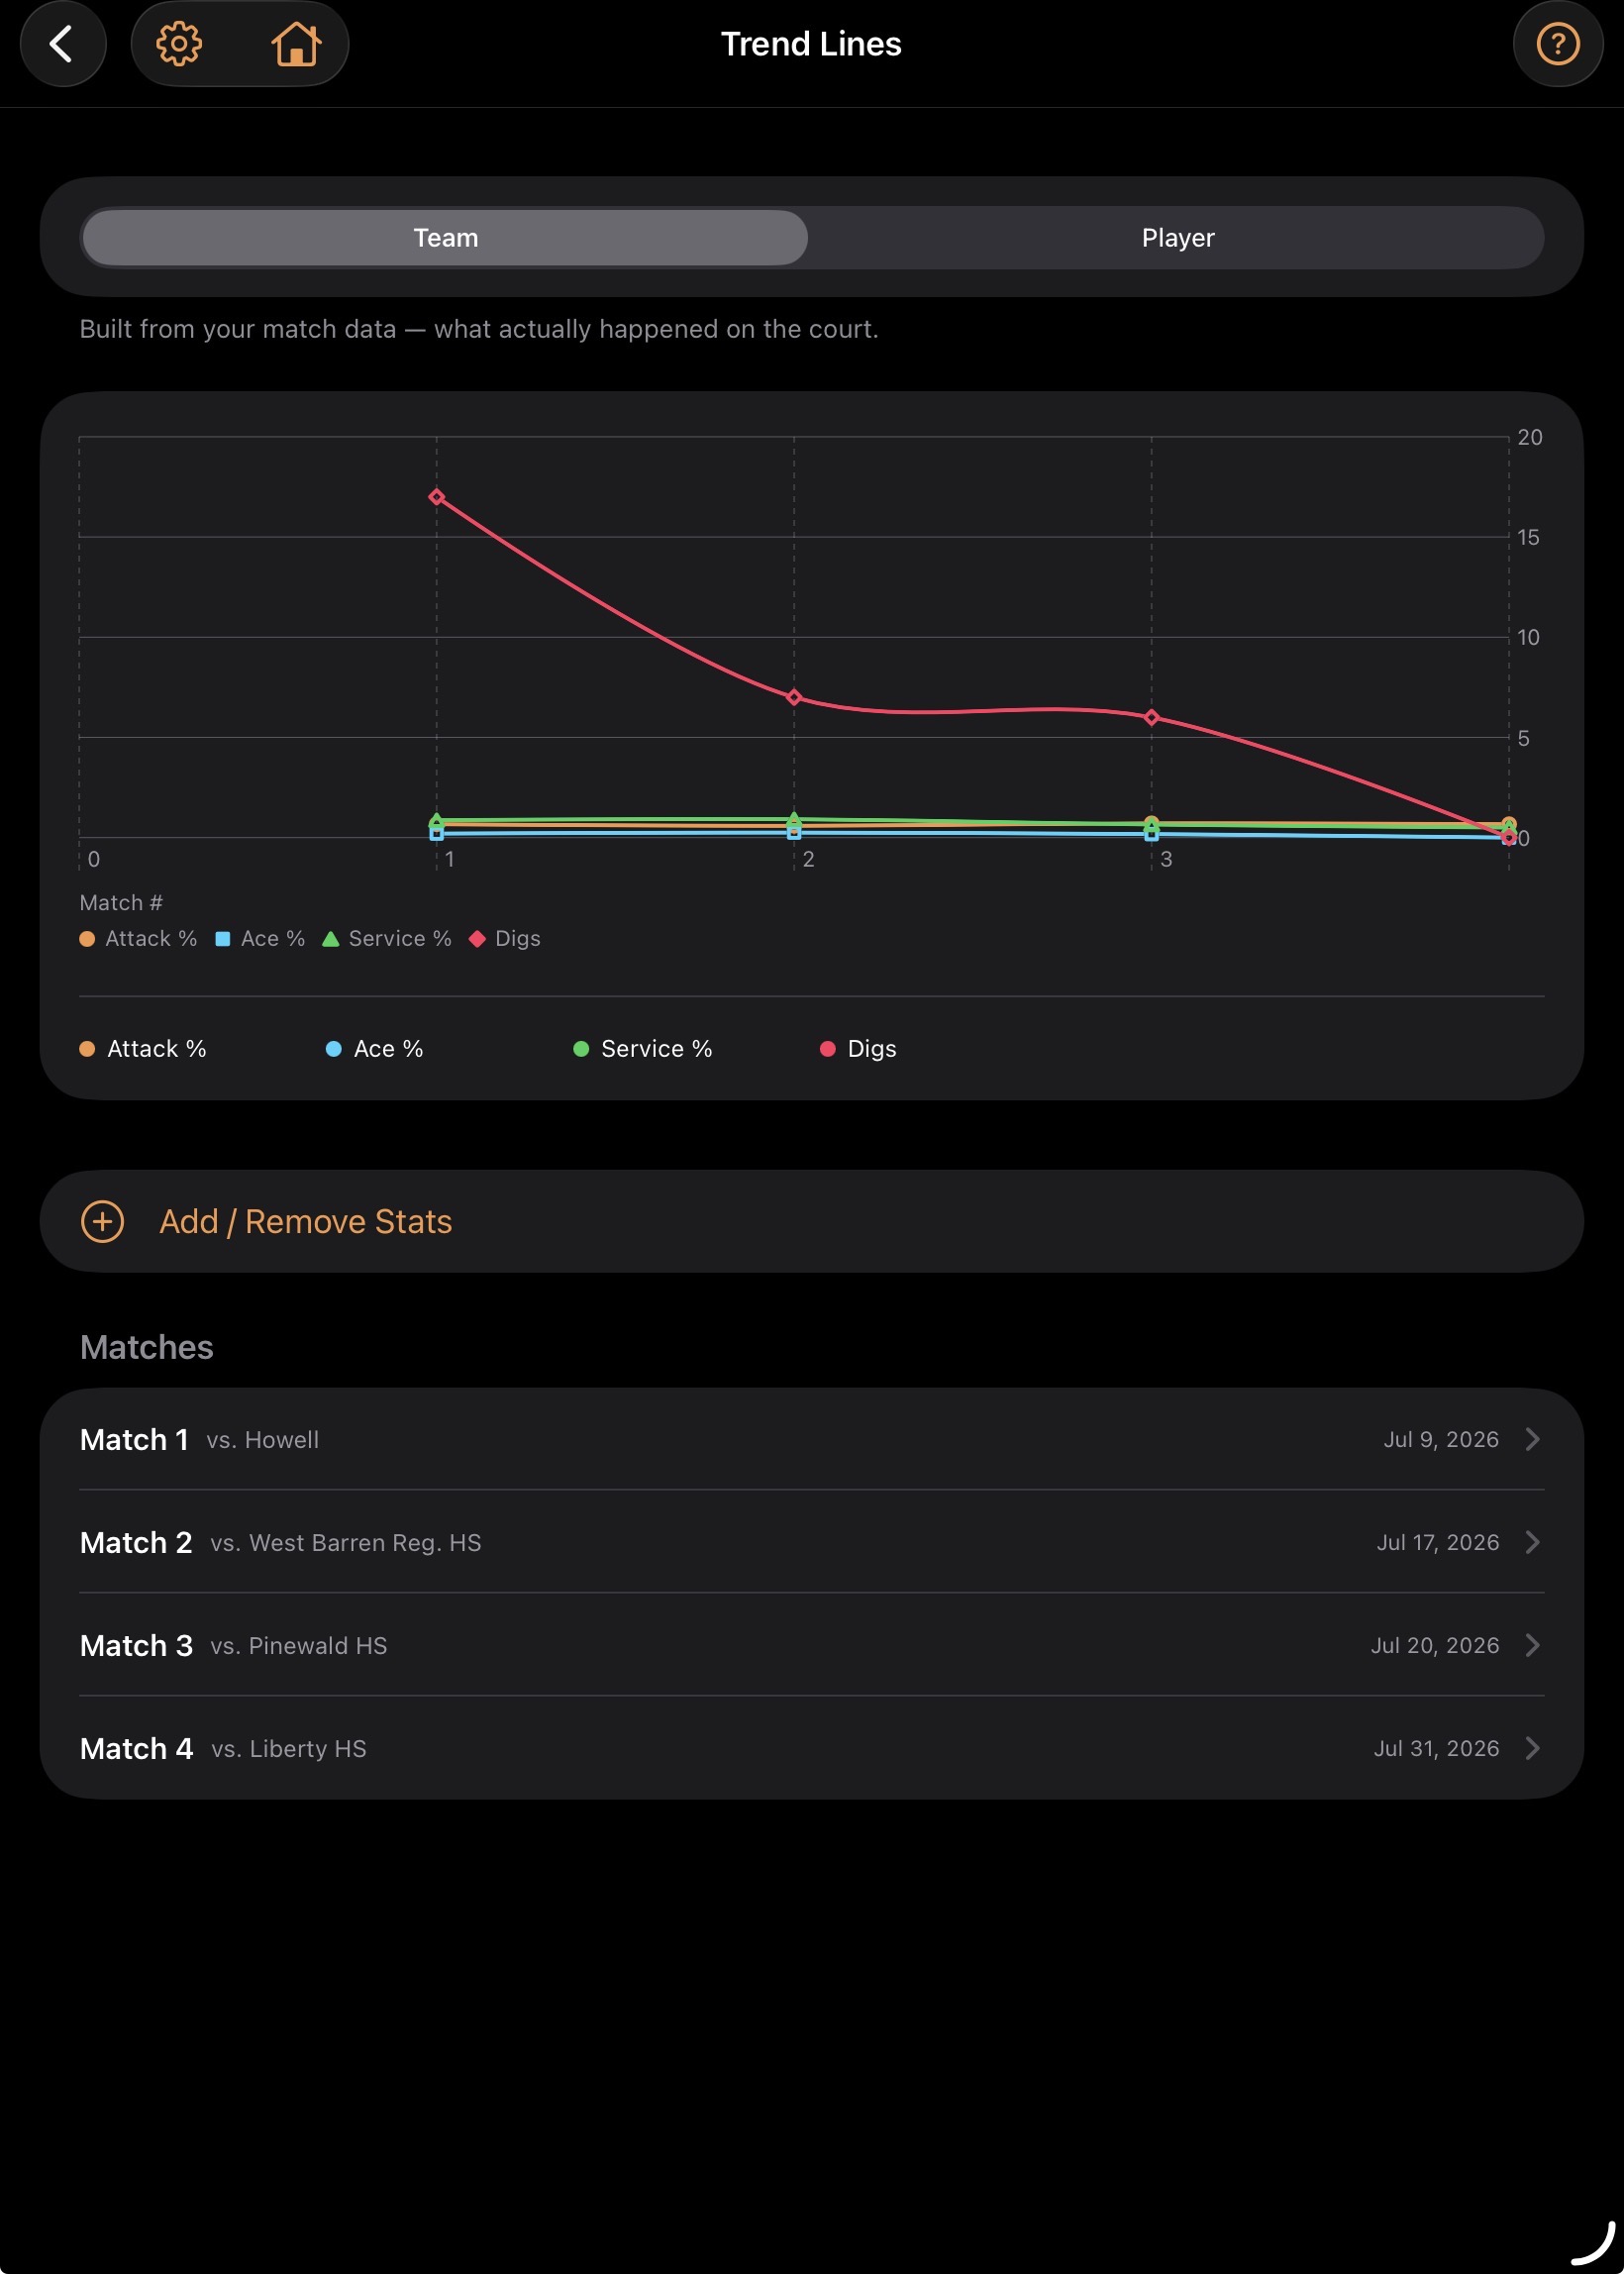
Trend Lines
Track how key stats move match to match across the season, so the shape of improvement (or decline) shows up clearly instead of getting lost in one noisy match.
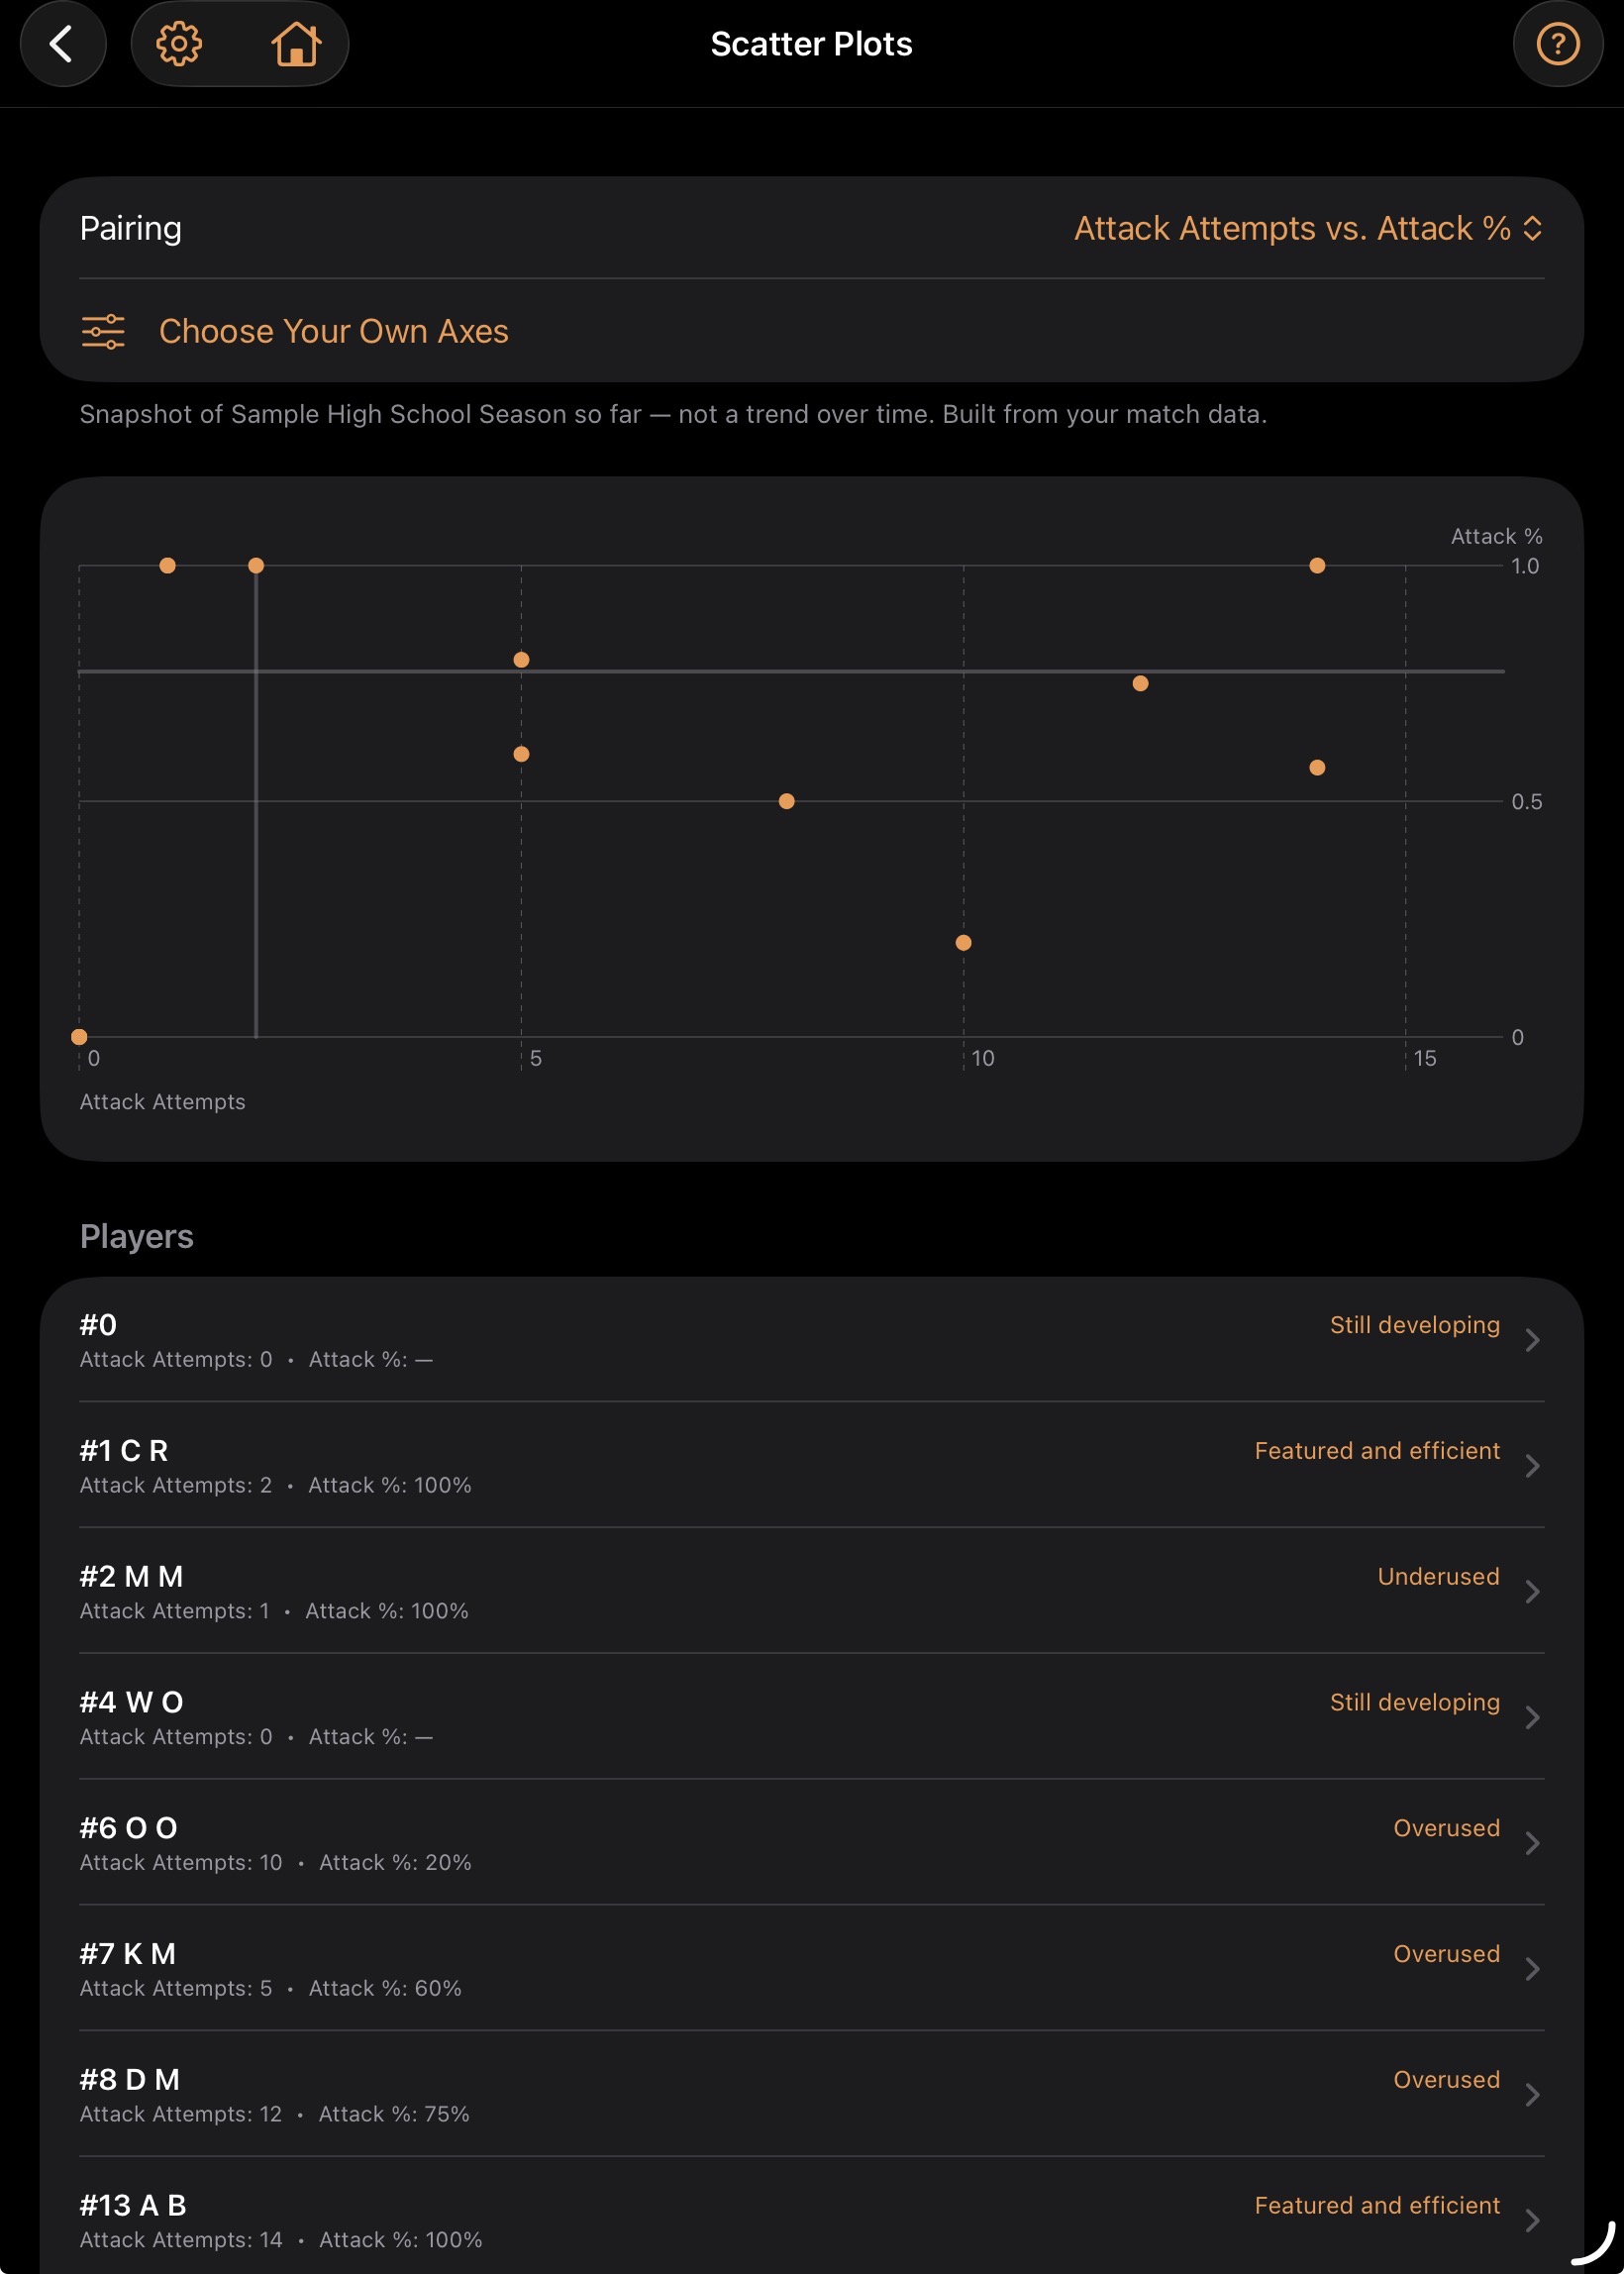
Scatter Plots
Compare two stats against each other across every charted match, surfacing patterns and outliers that only show up when two numbers are plotted together.
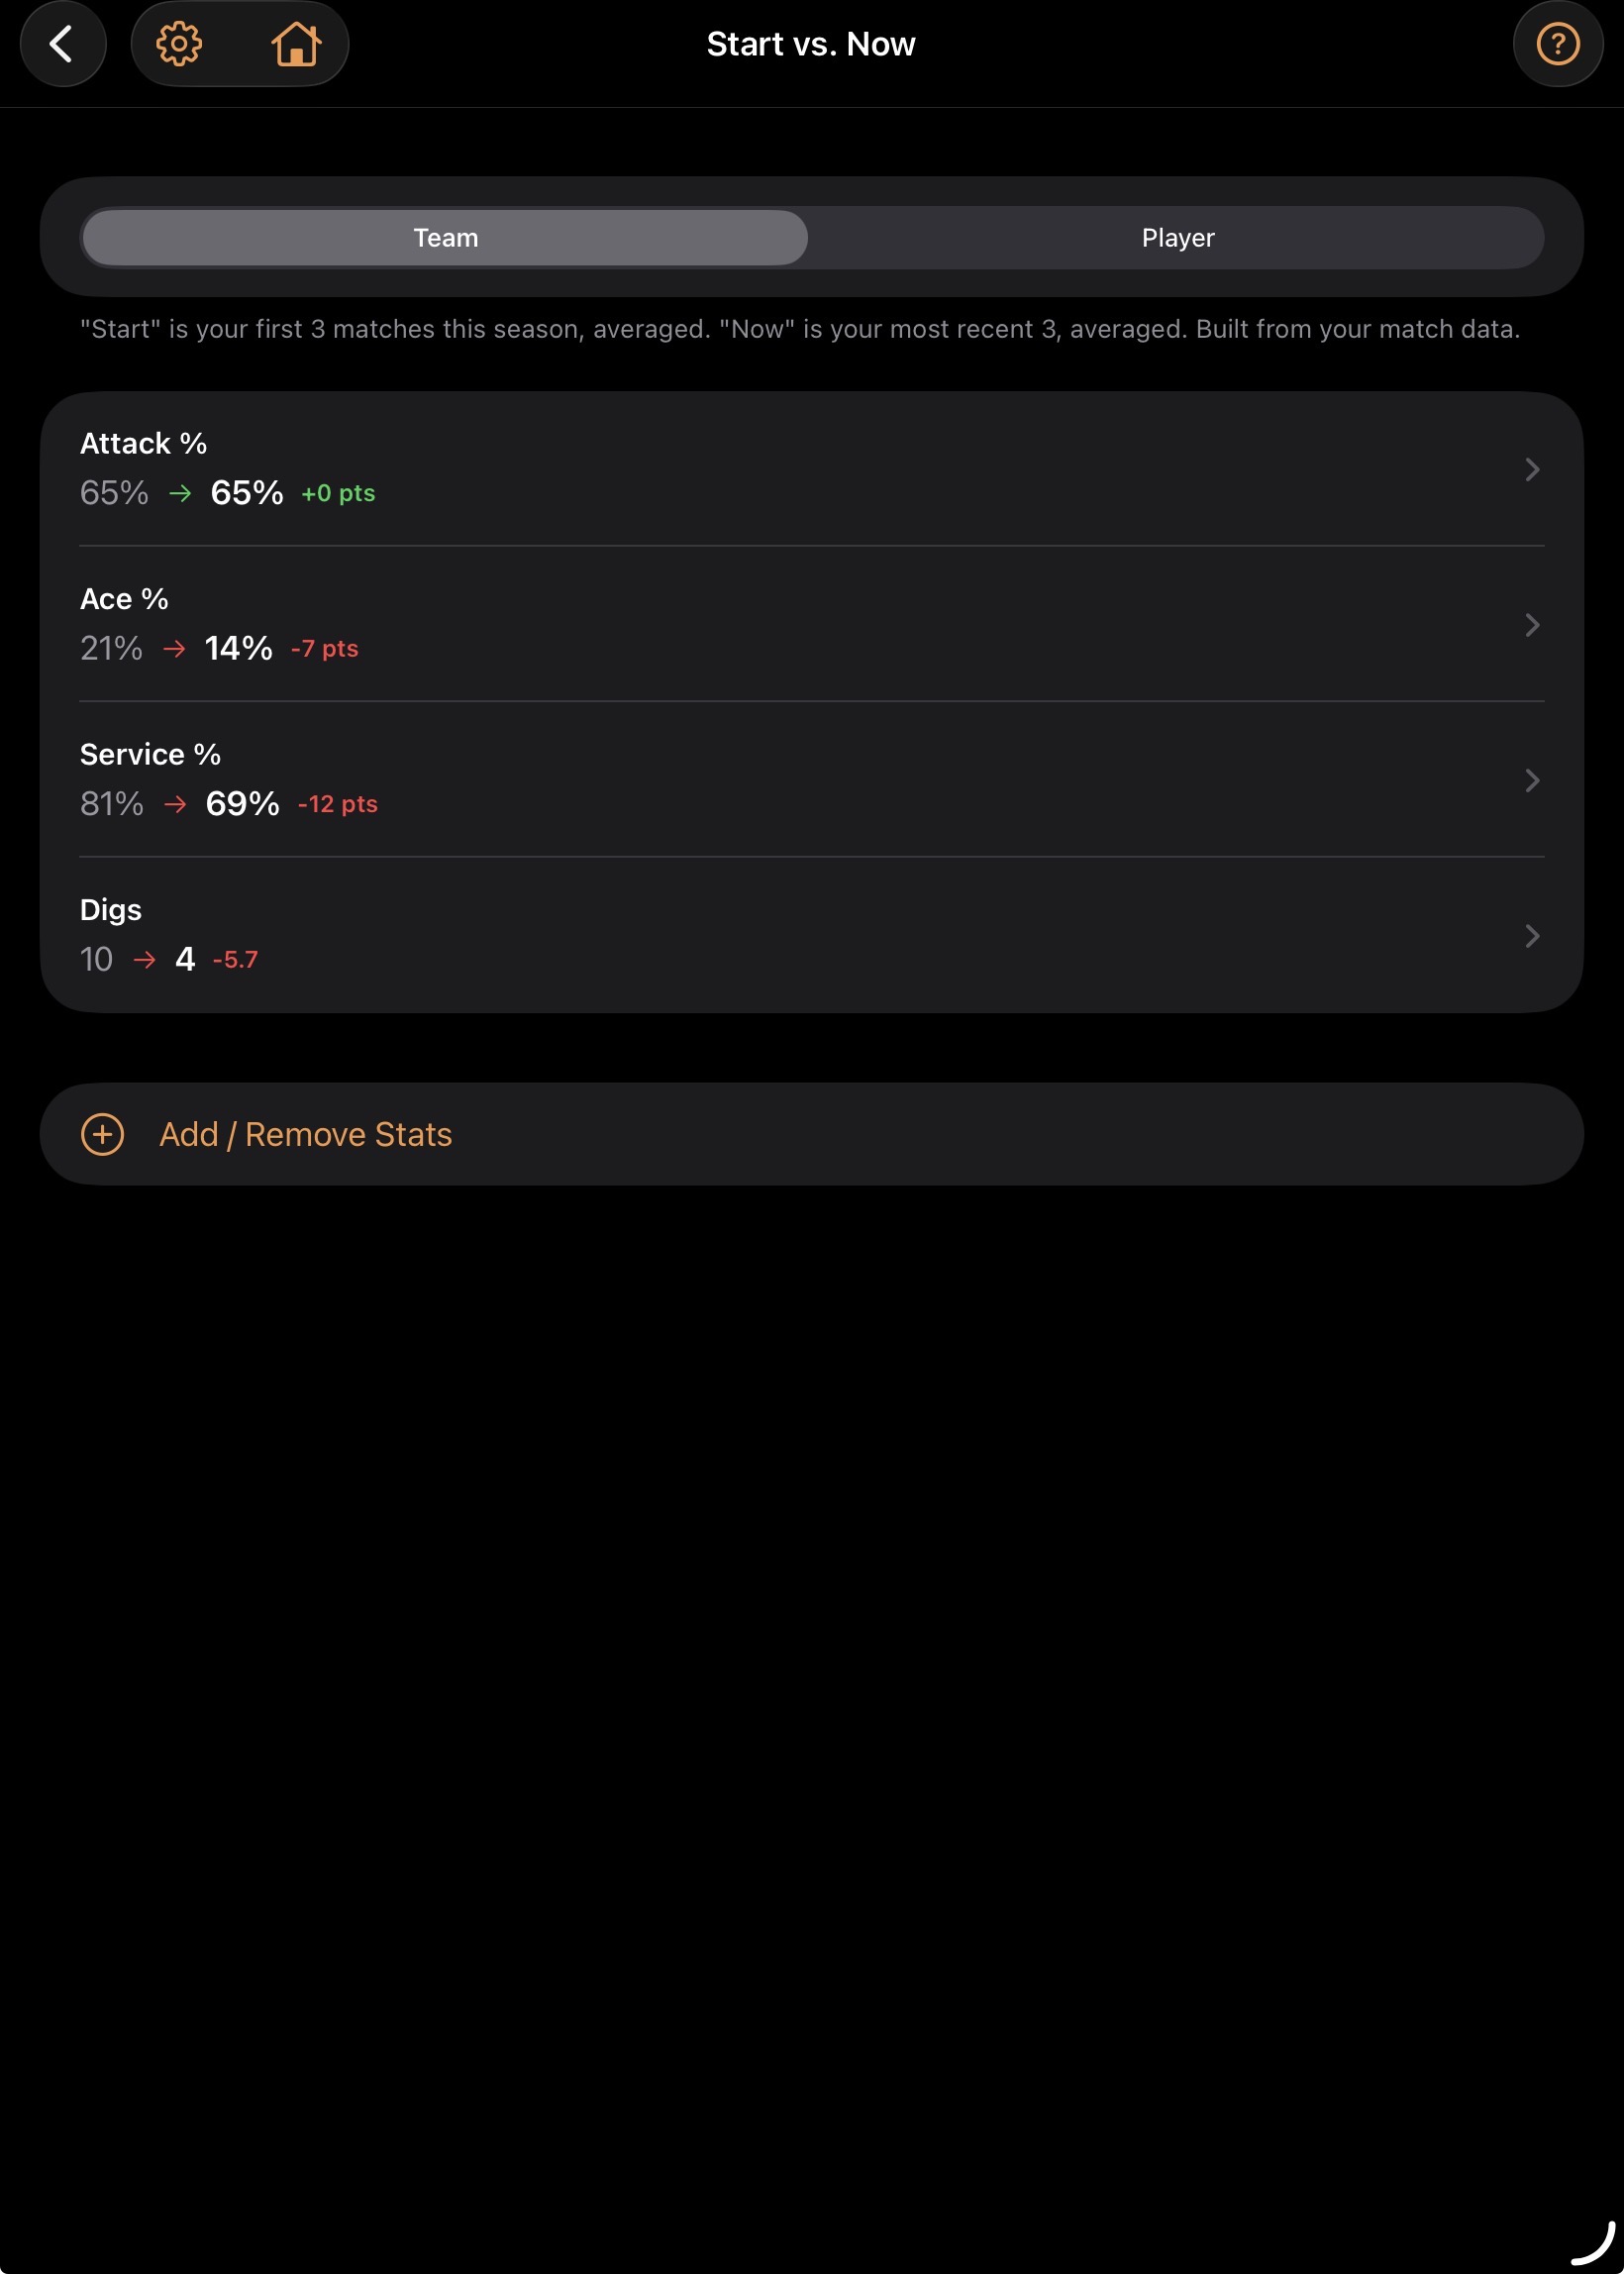
Start vs. Now
A direct before-and-after: the team's numbers at the start of the season next to where they stand today, the clearest single snapshot of progress.
Radar Chart
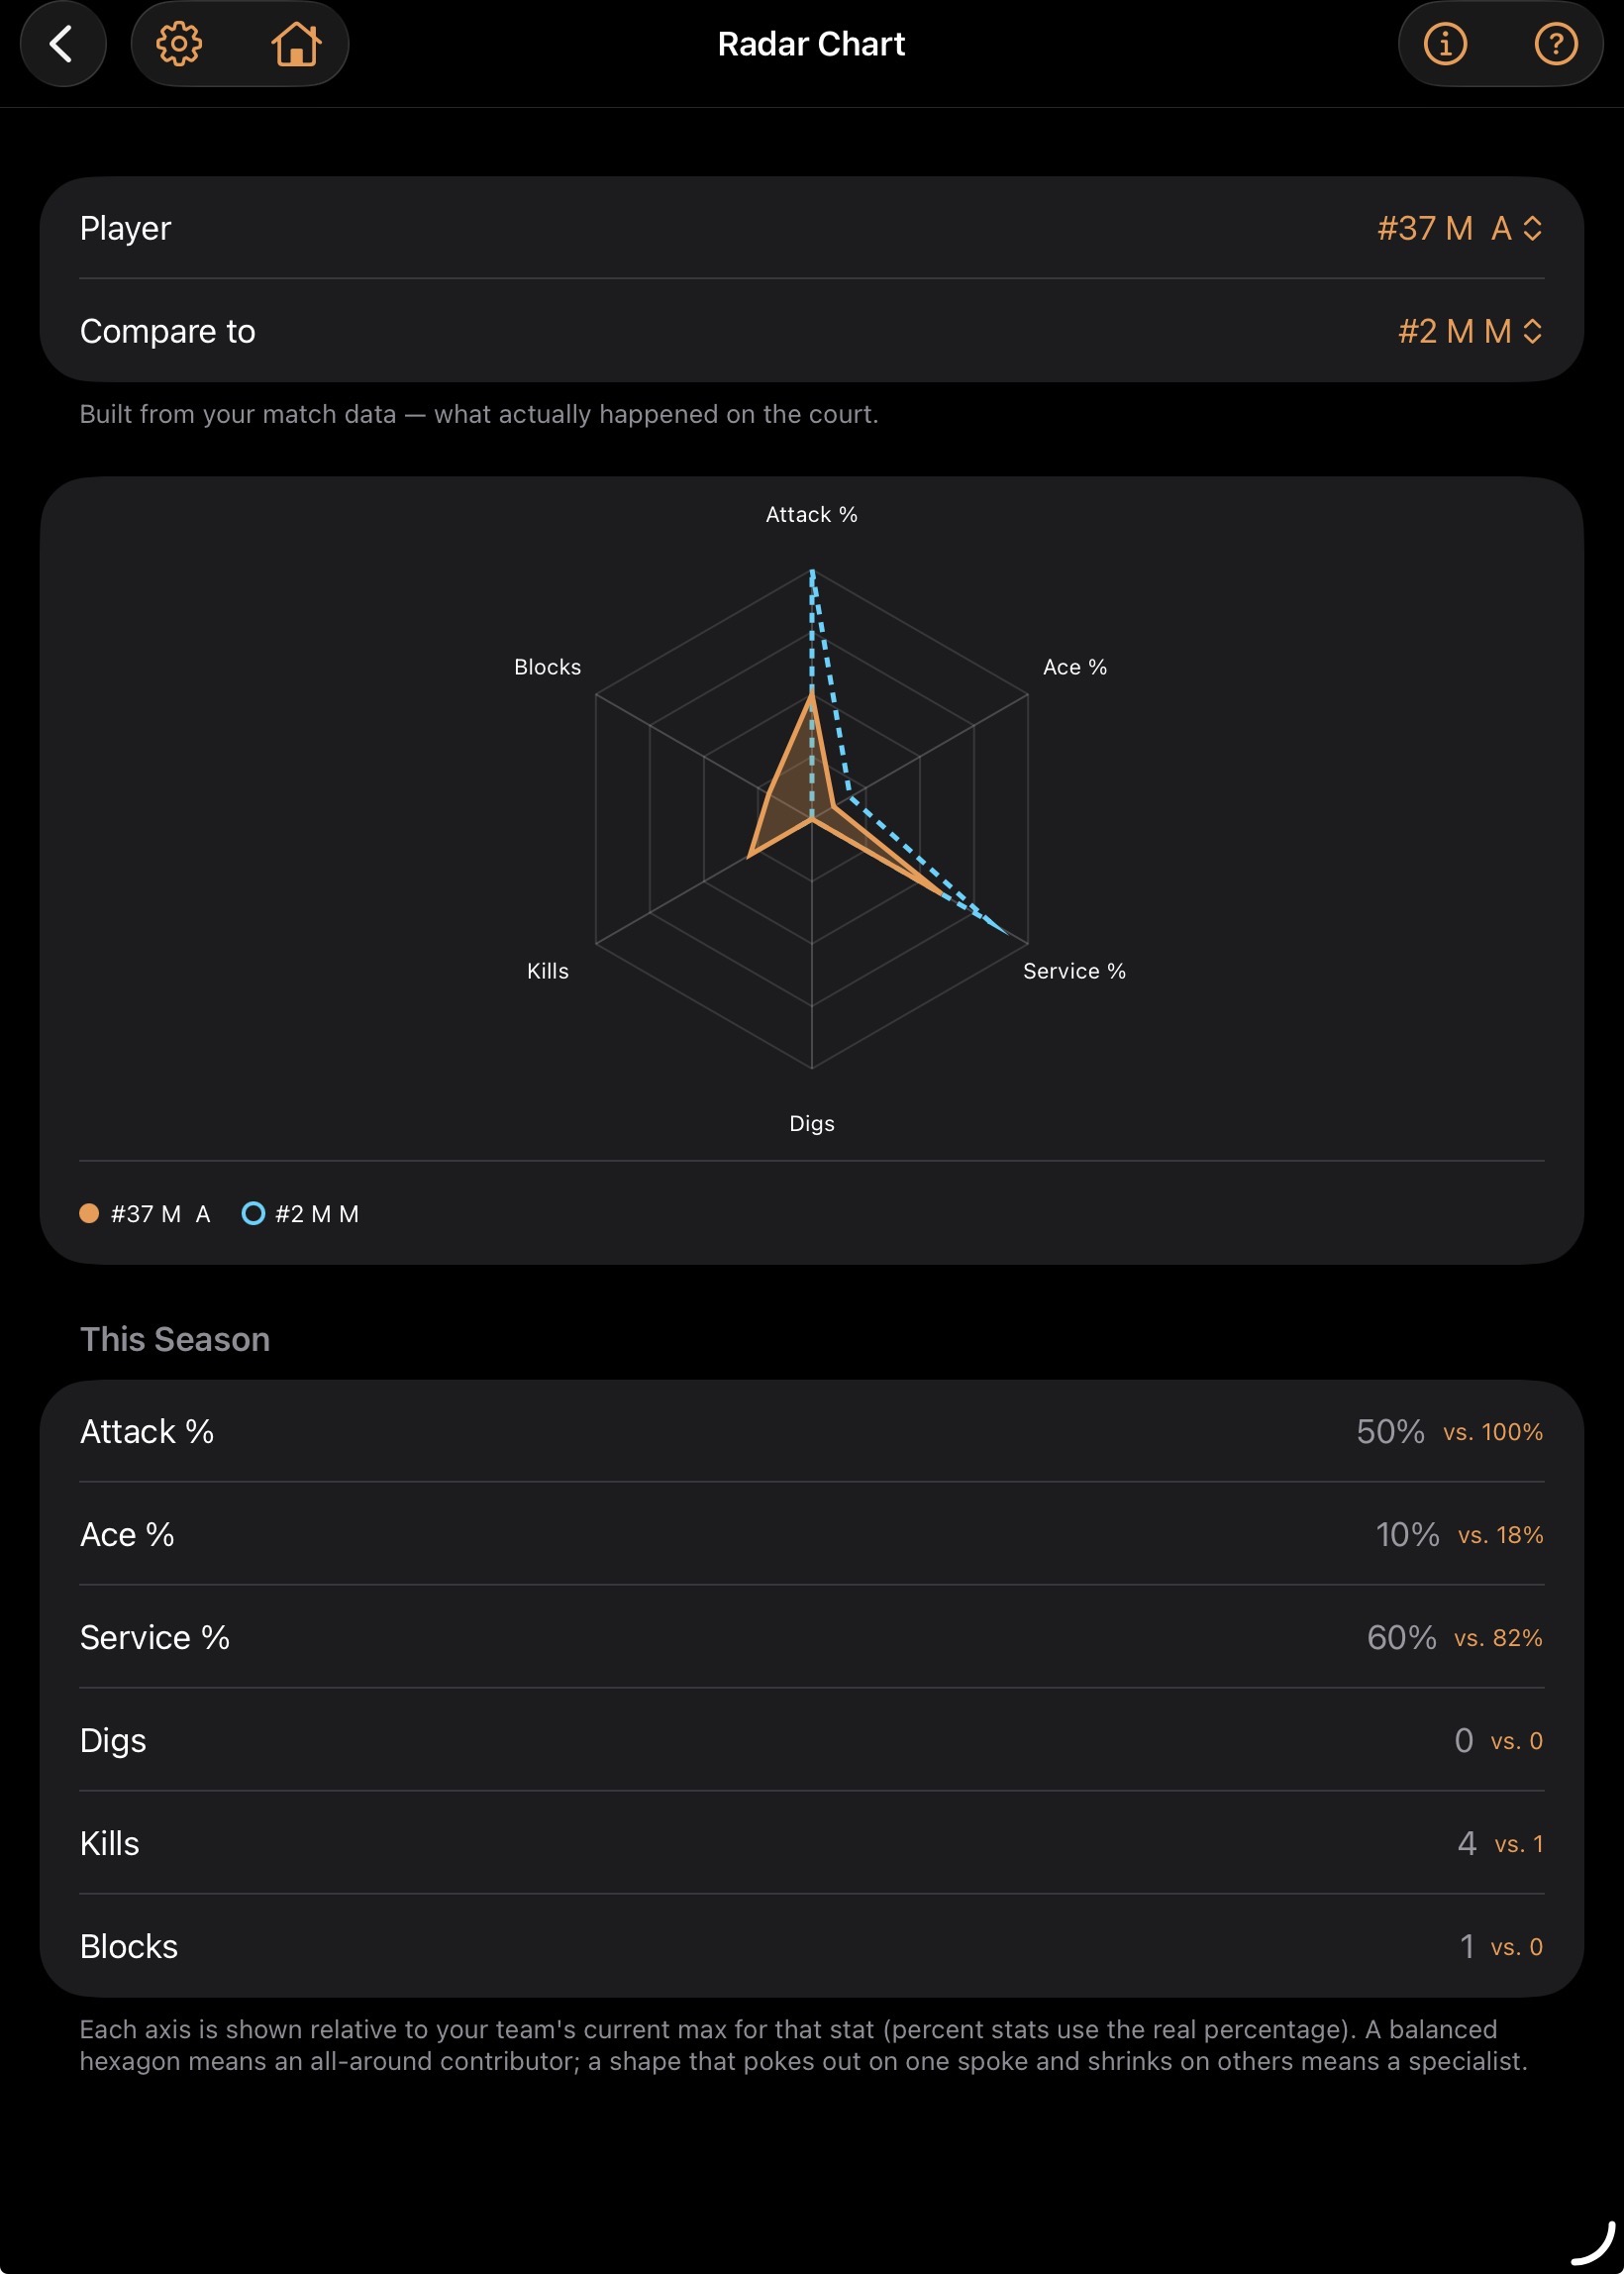
Maps a player's shape across multiple stat categories at once — Attack %, Ace %, Service %, Digs, Kills, and Blocks — showing strengths and gaps at a glance, with a second player to compare against.
Heatmap Evolution
See how the team's court coverage and tendencies have shifted as the season has gone on — the one Team Growth view that's spatial, not just numeric.